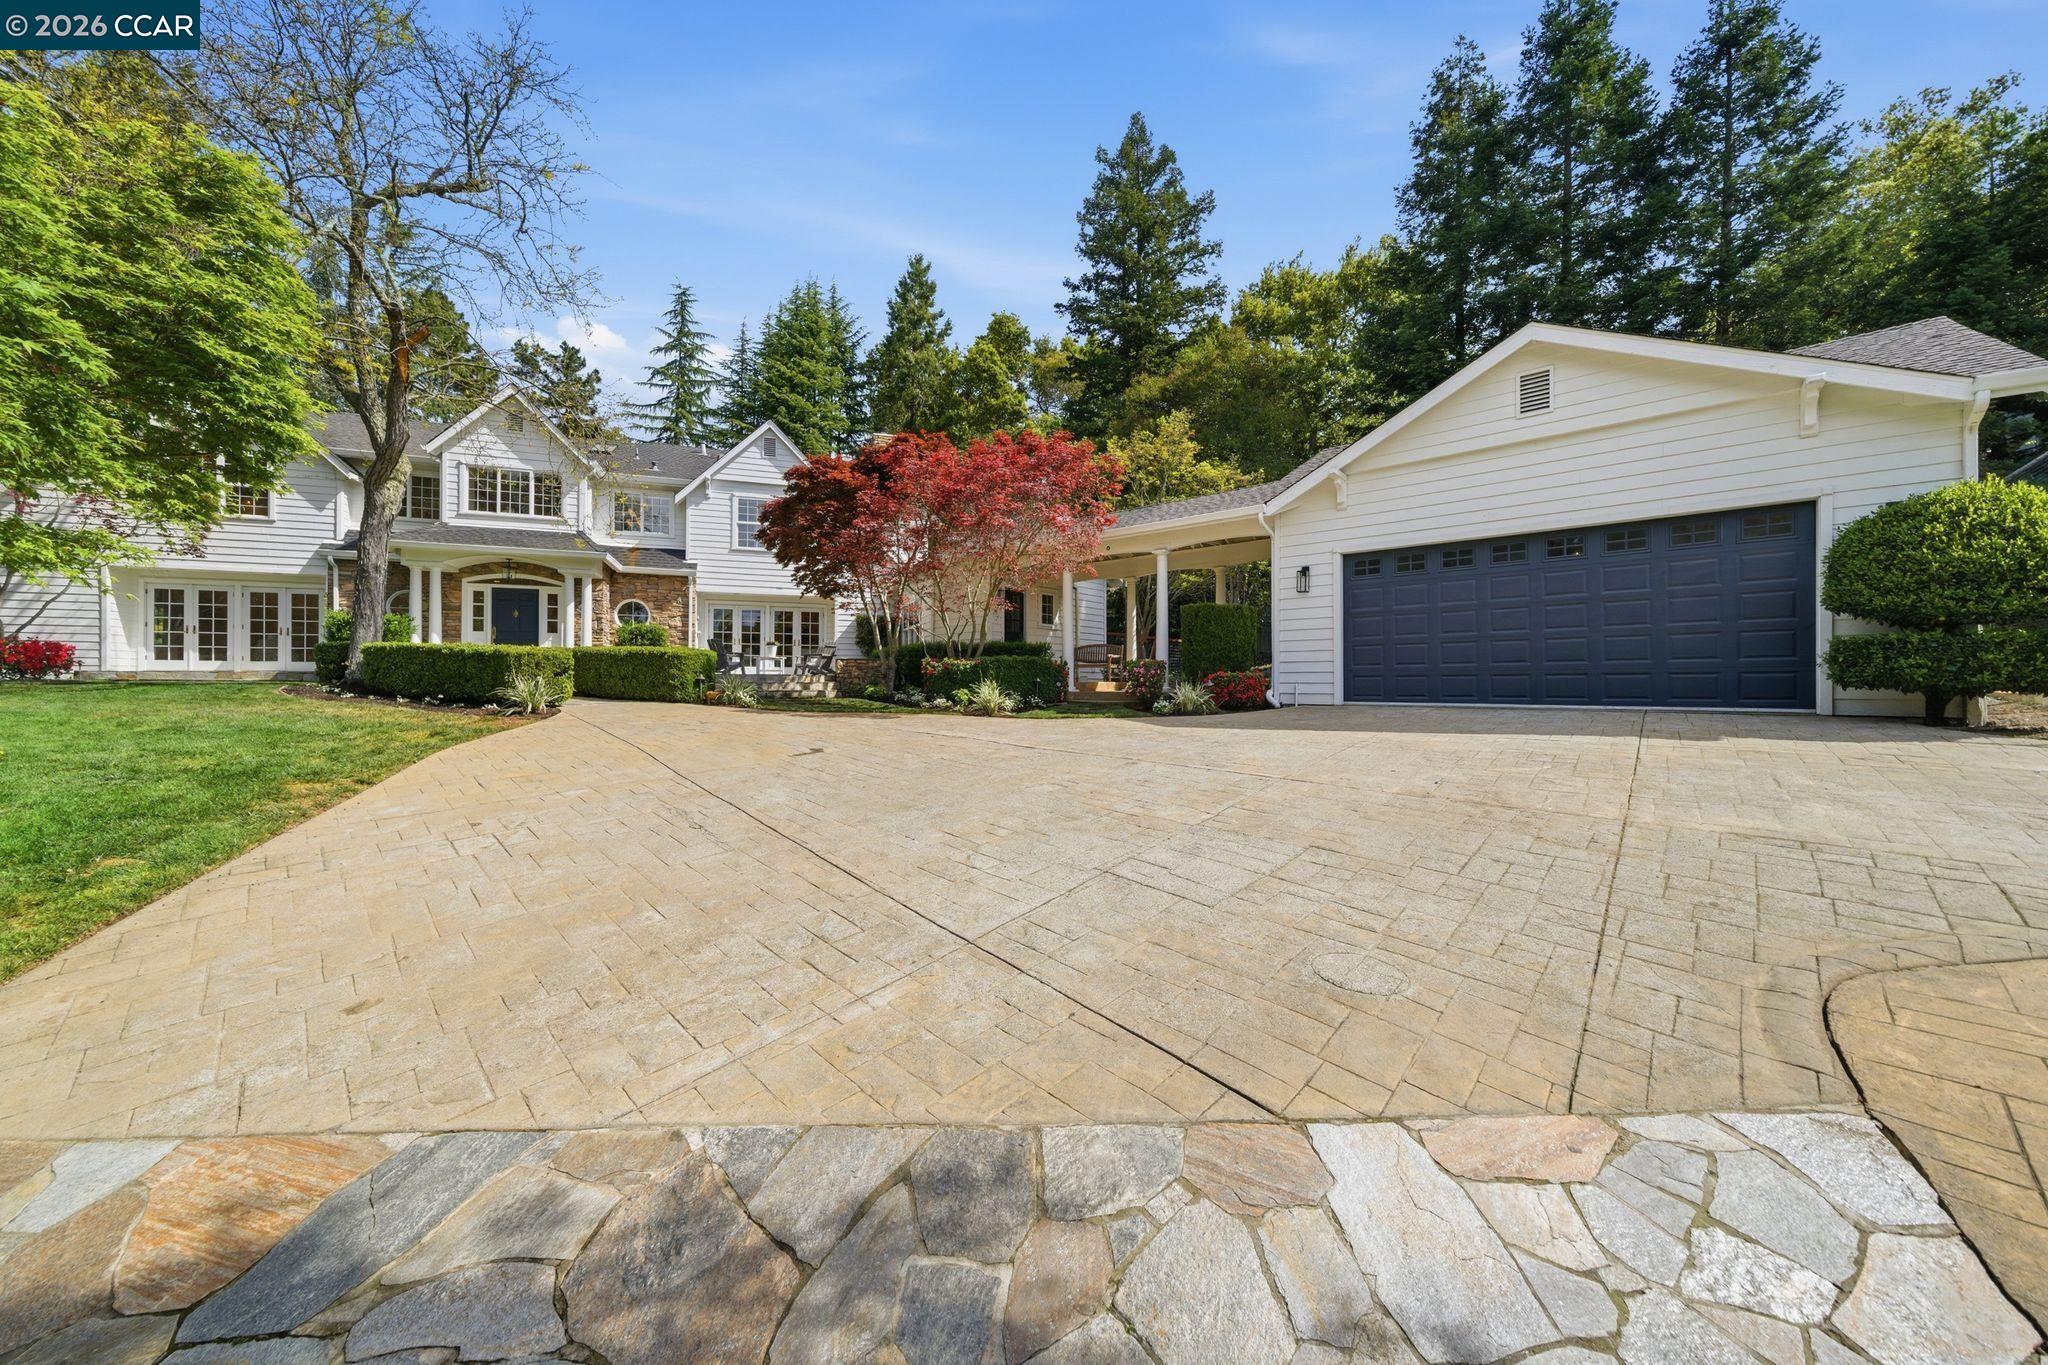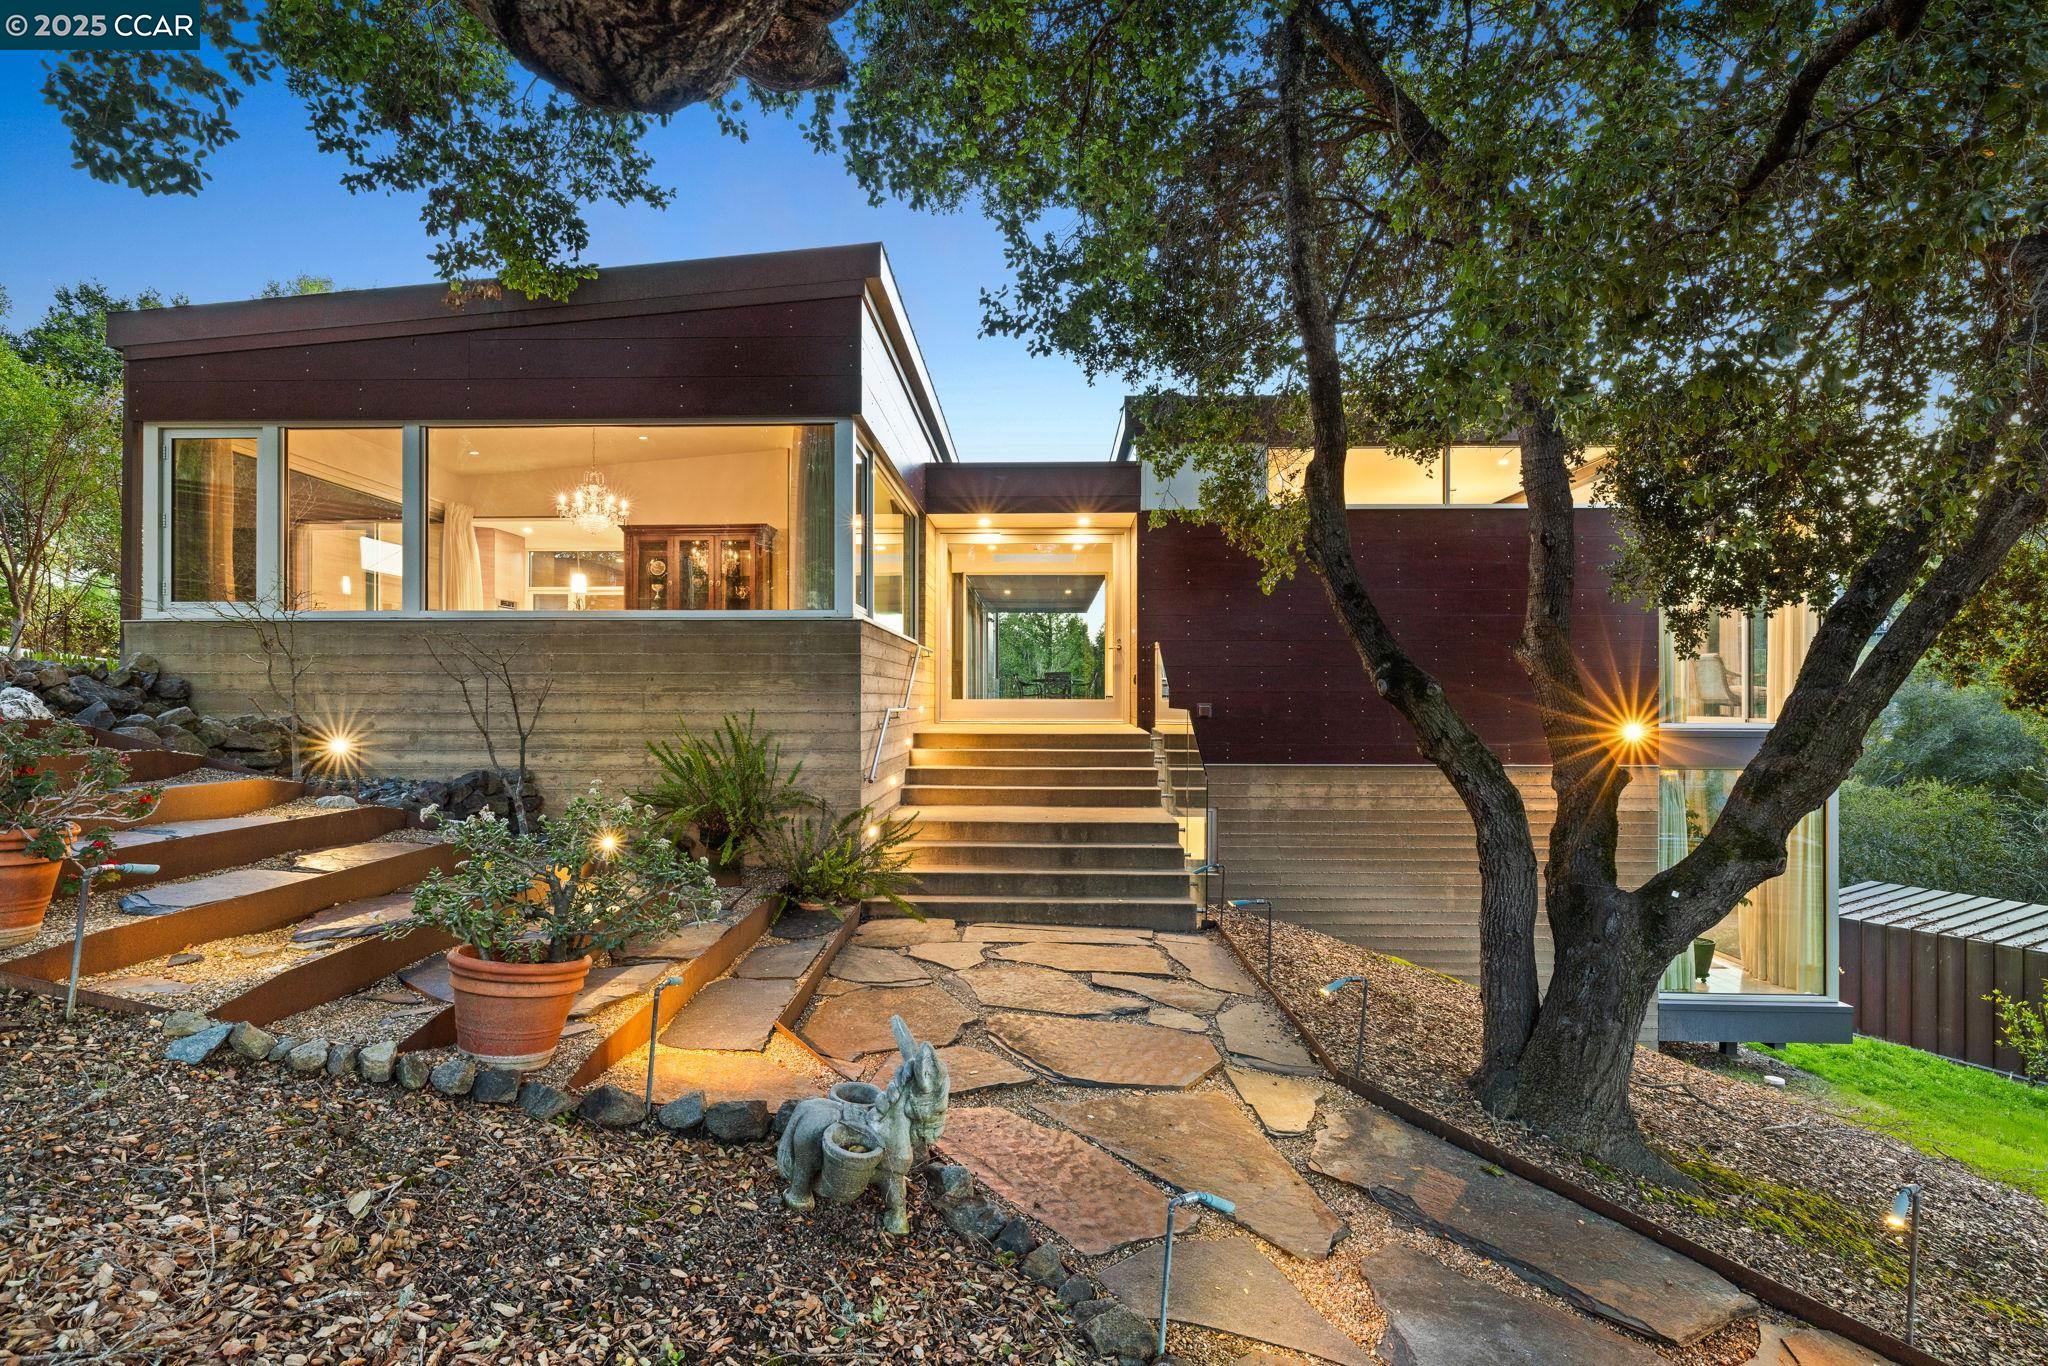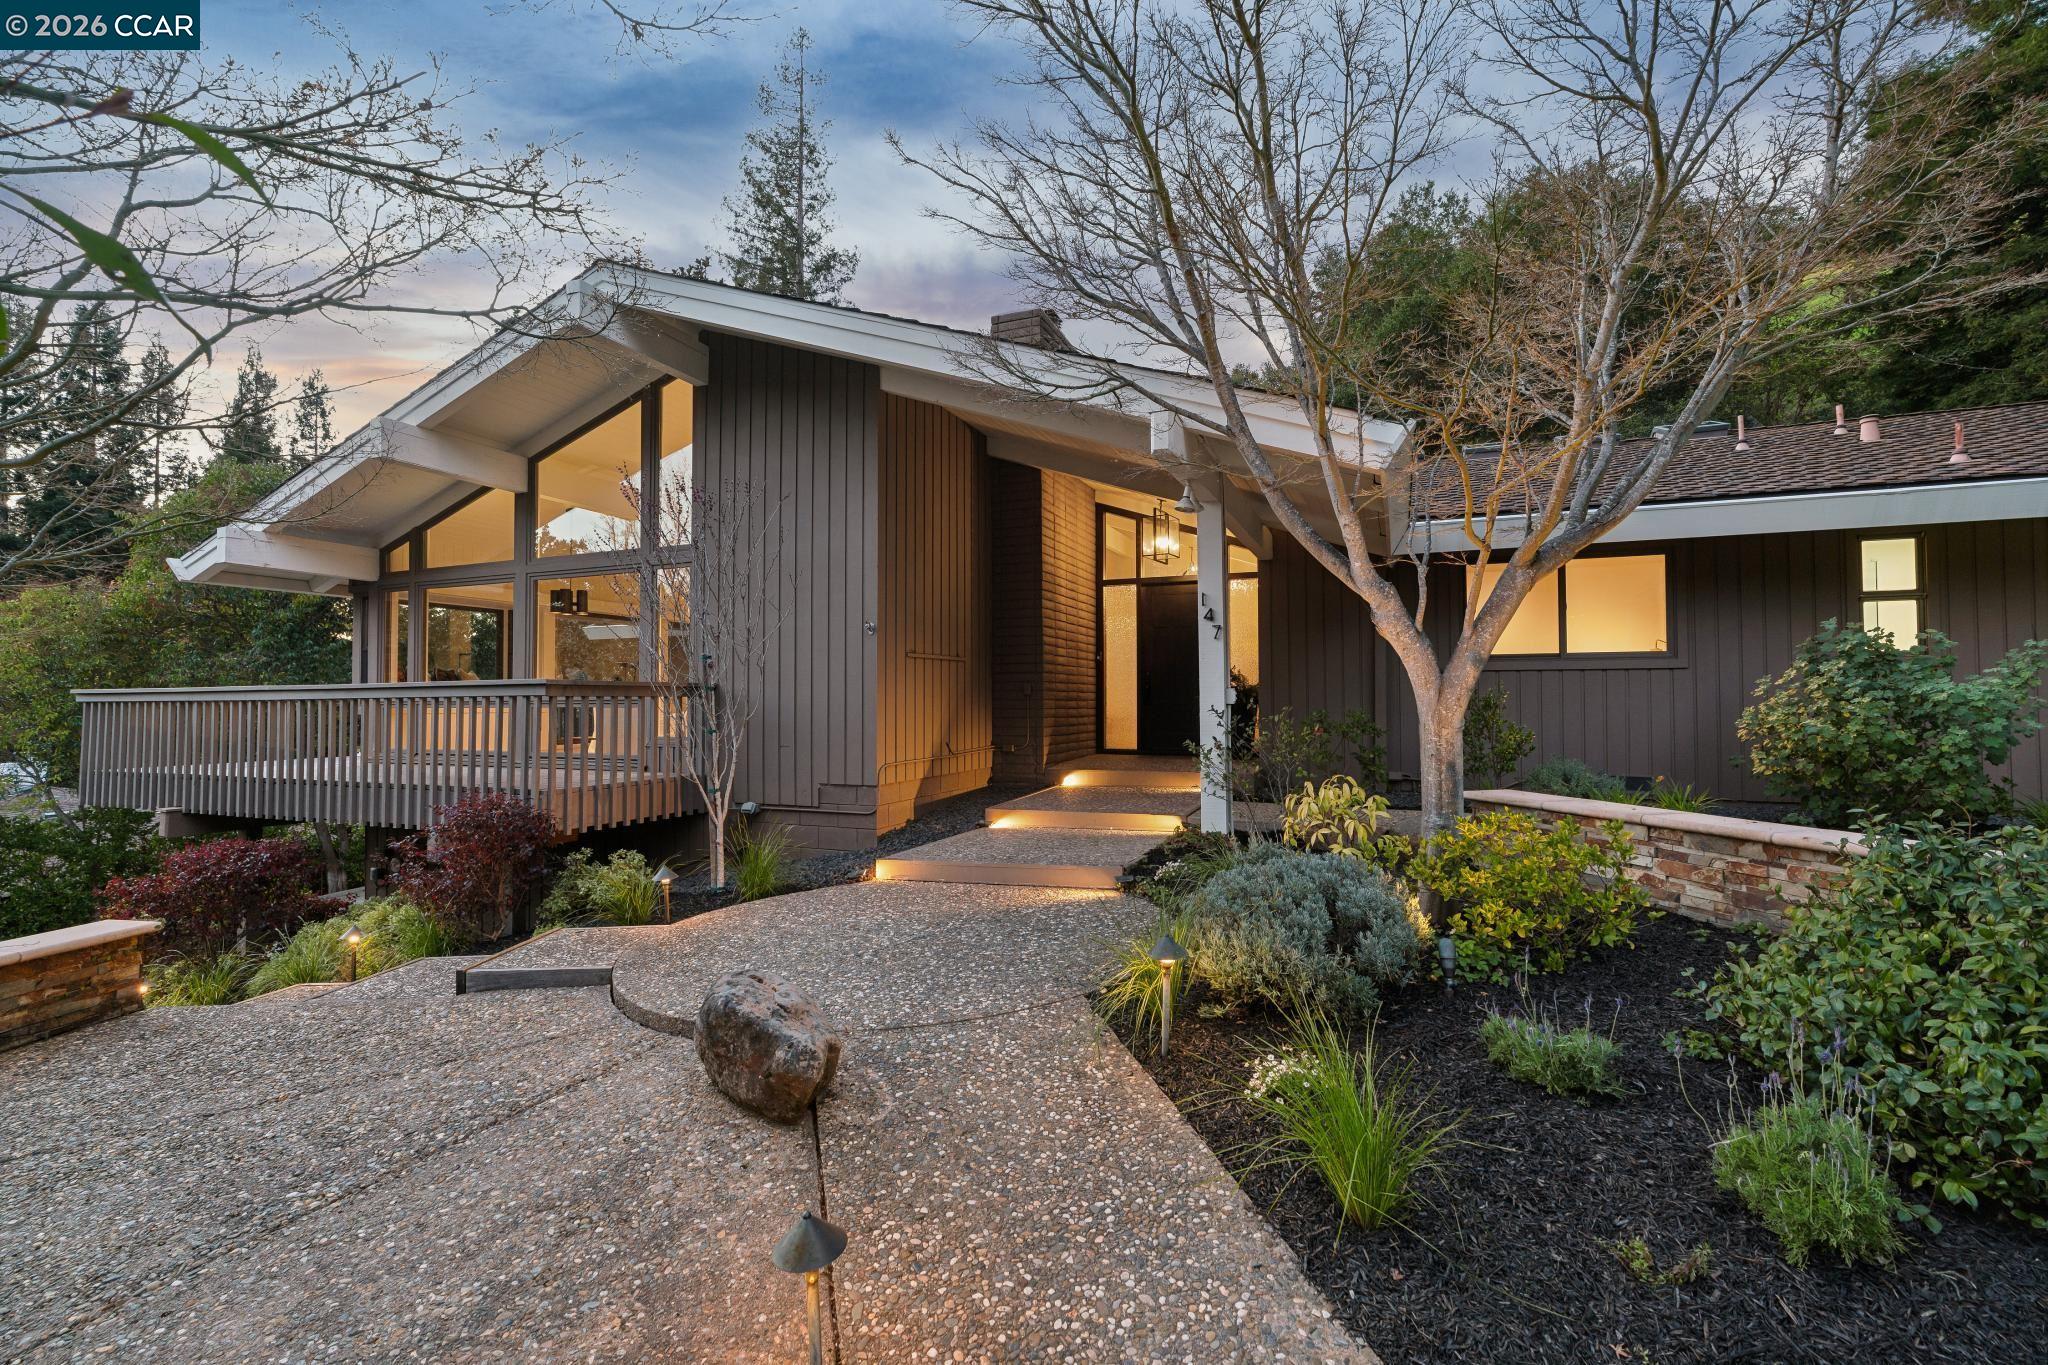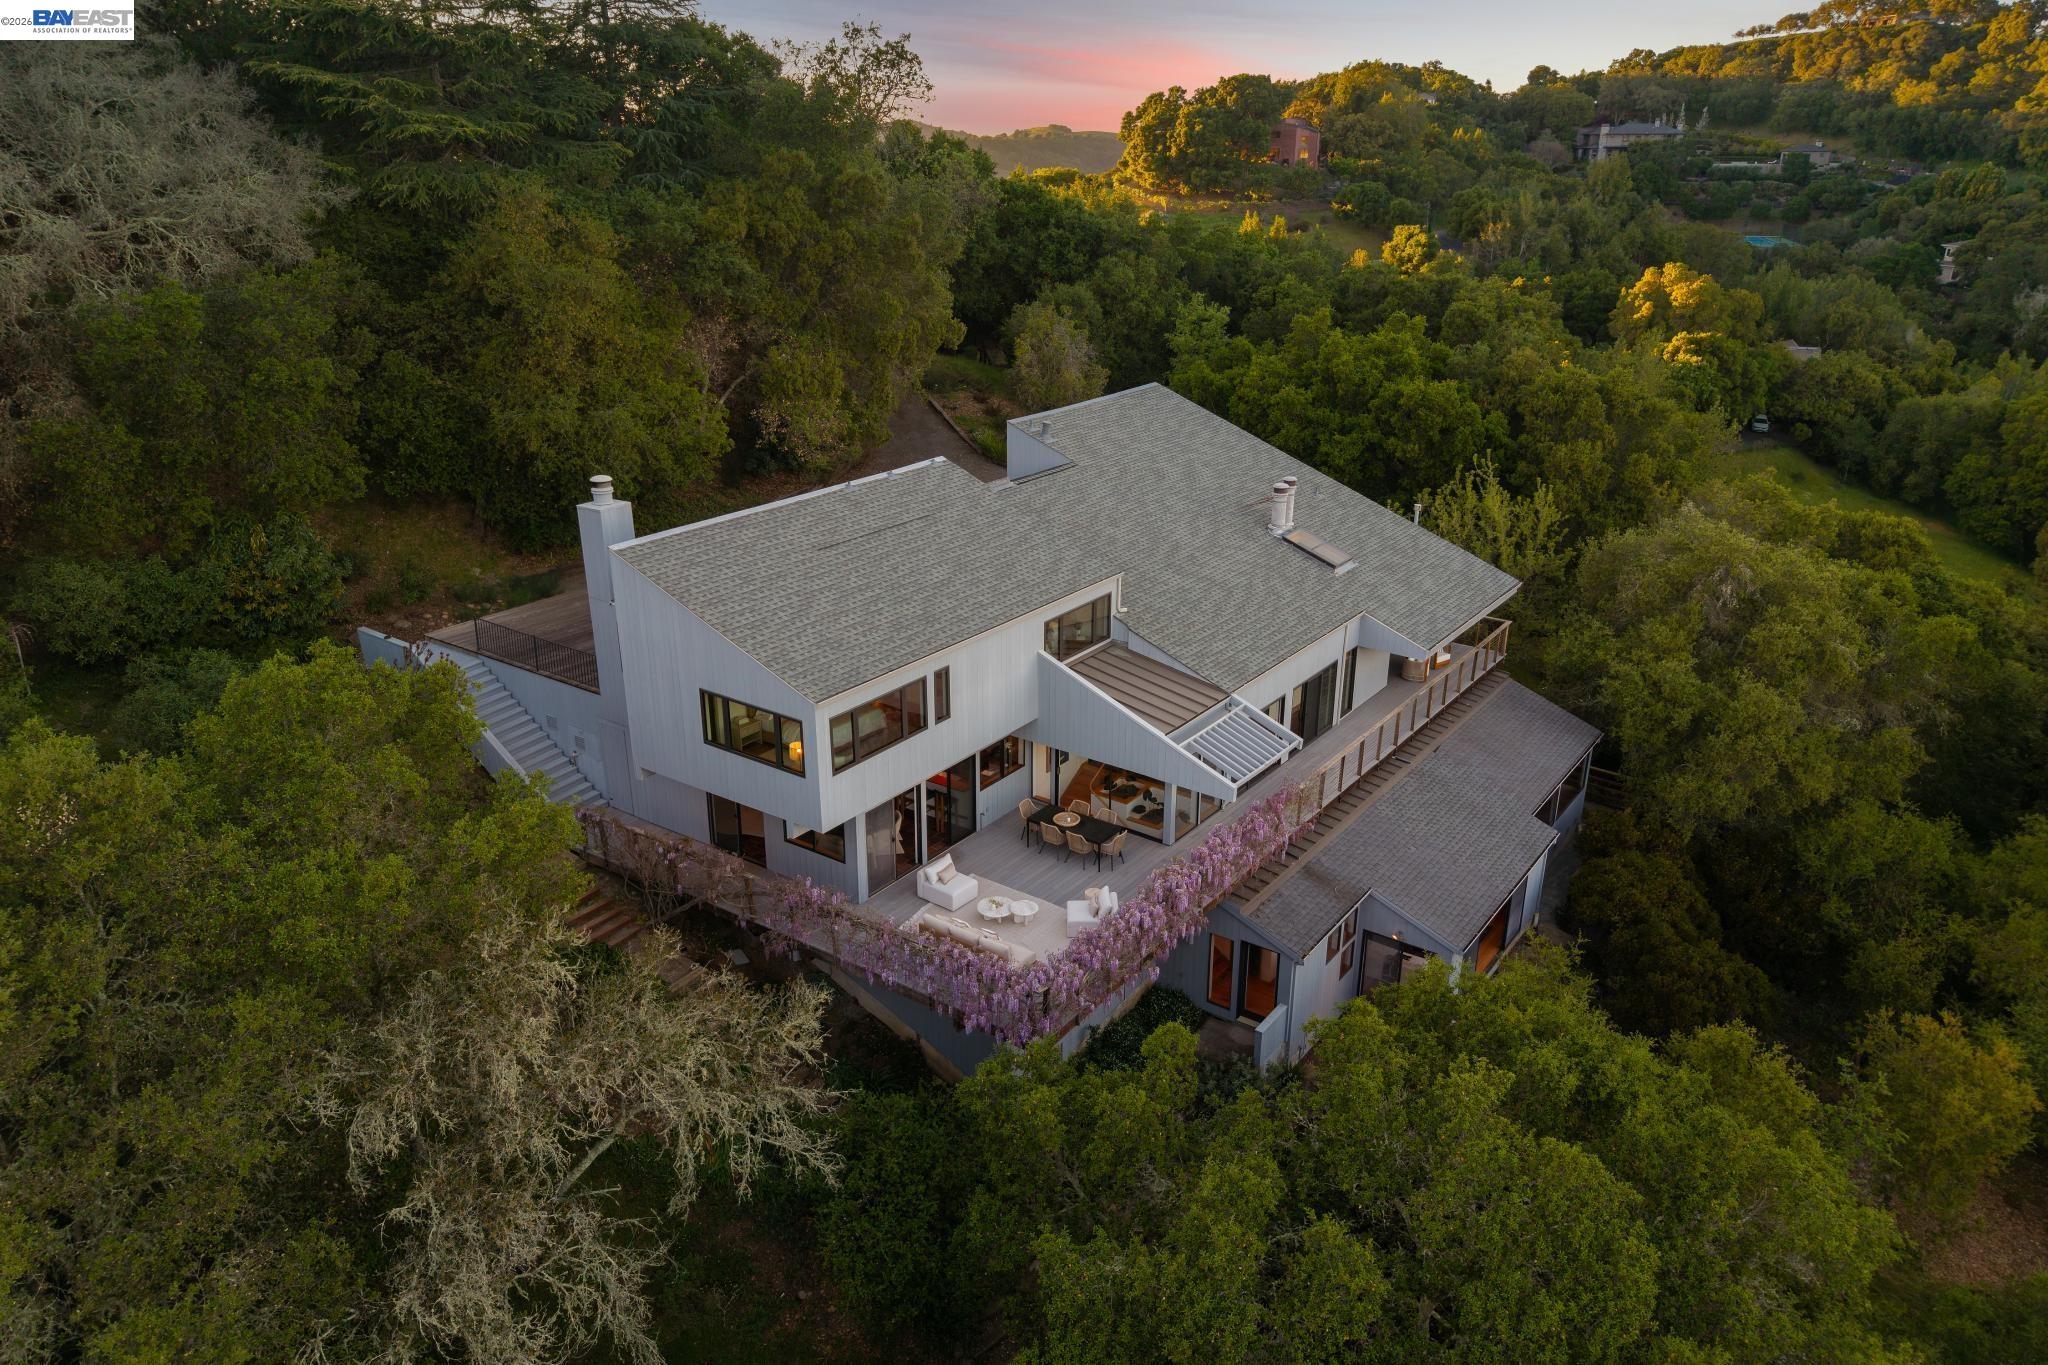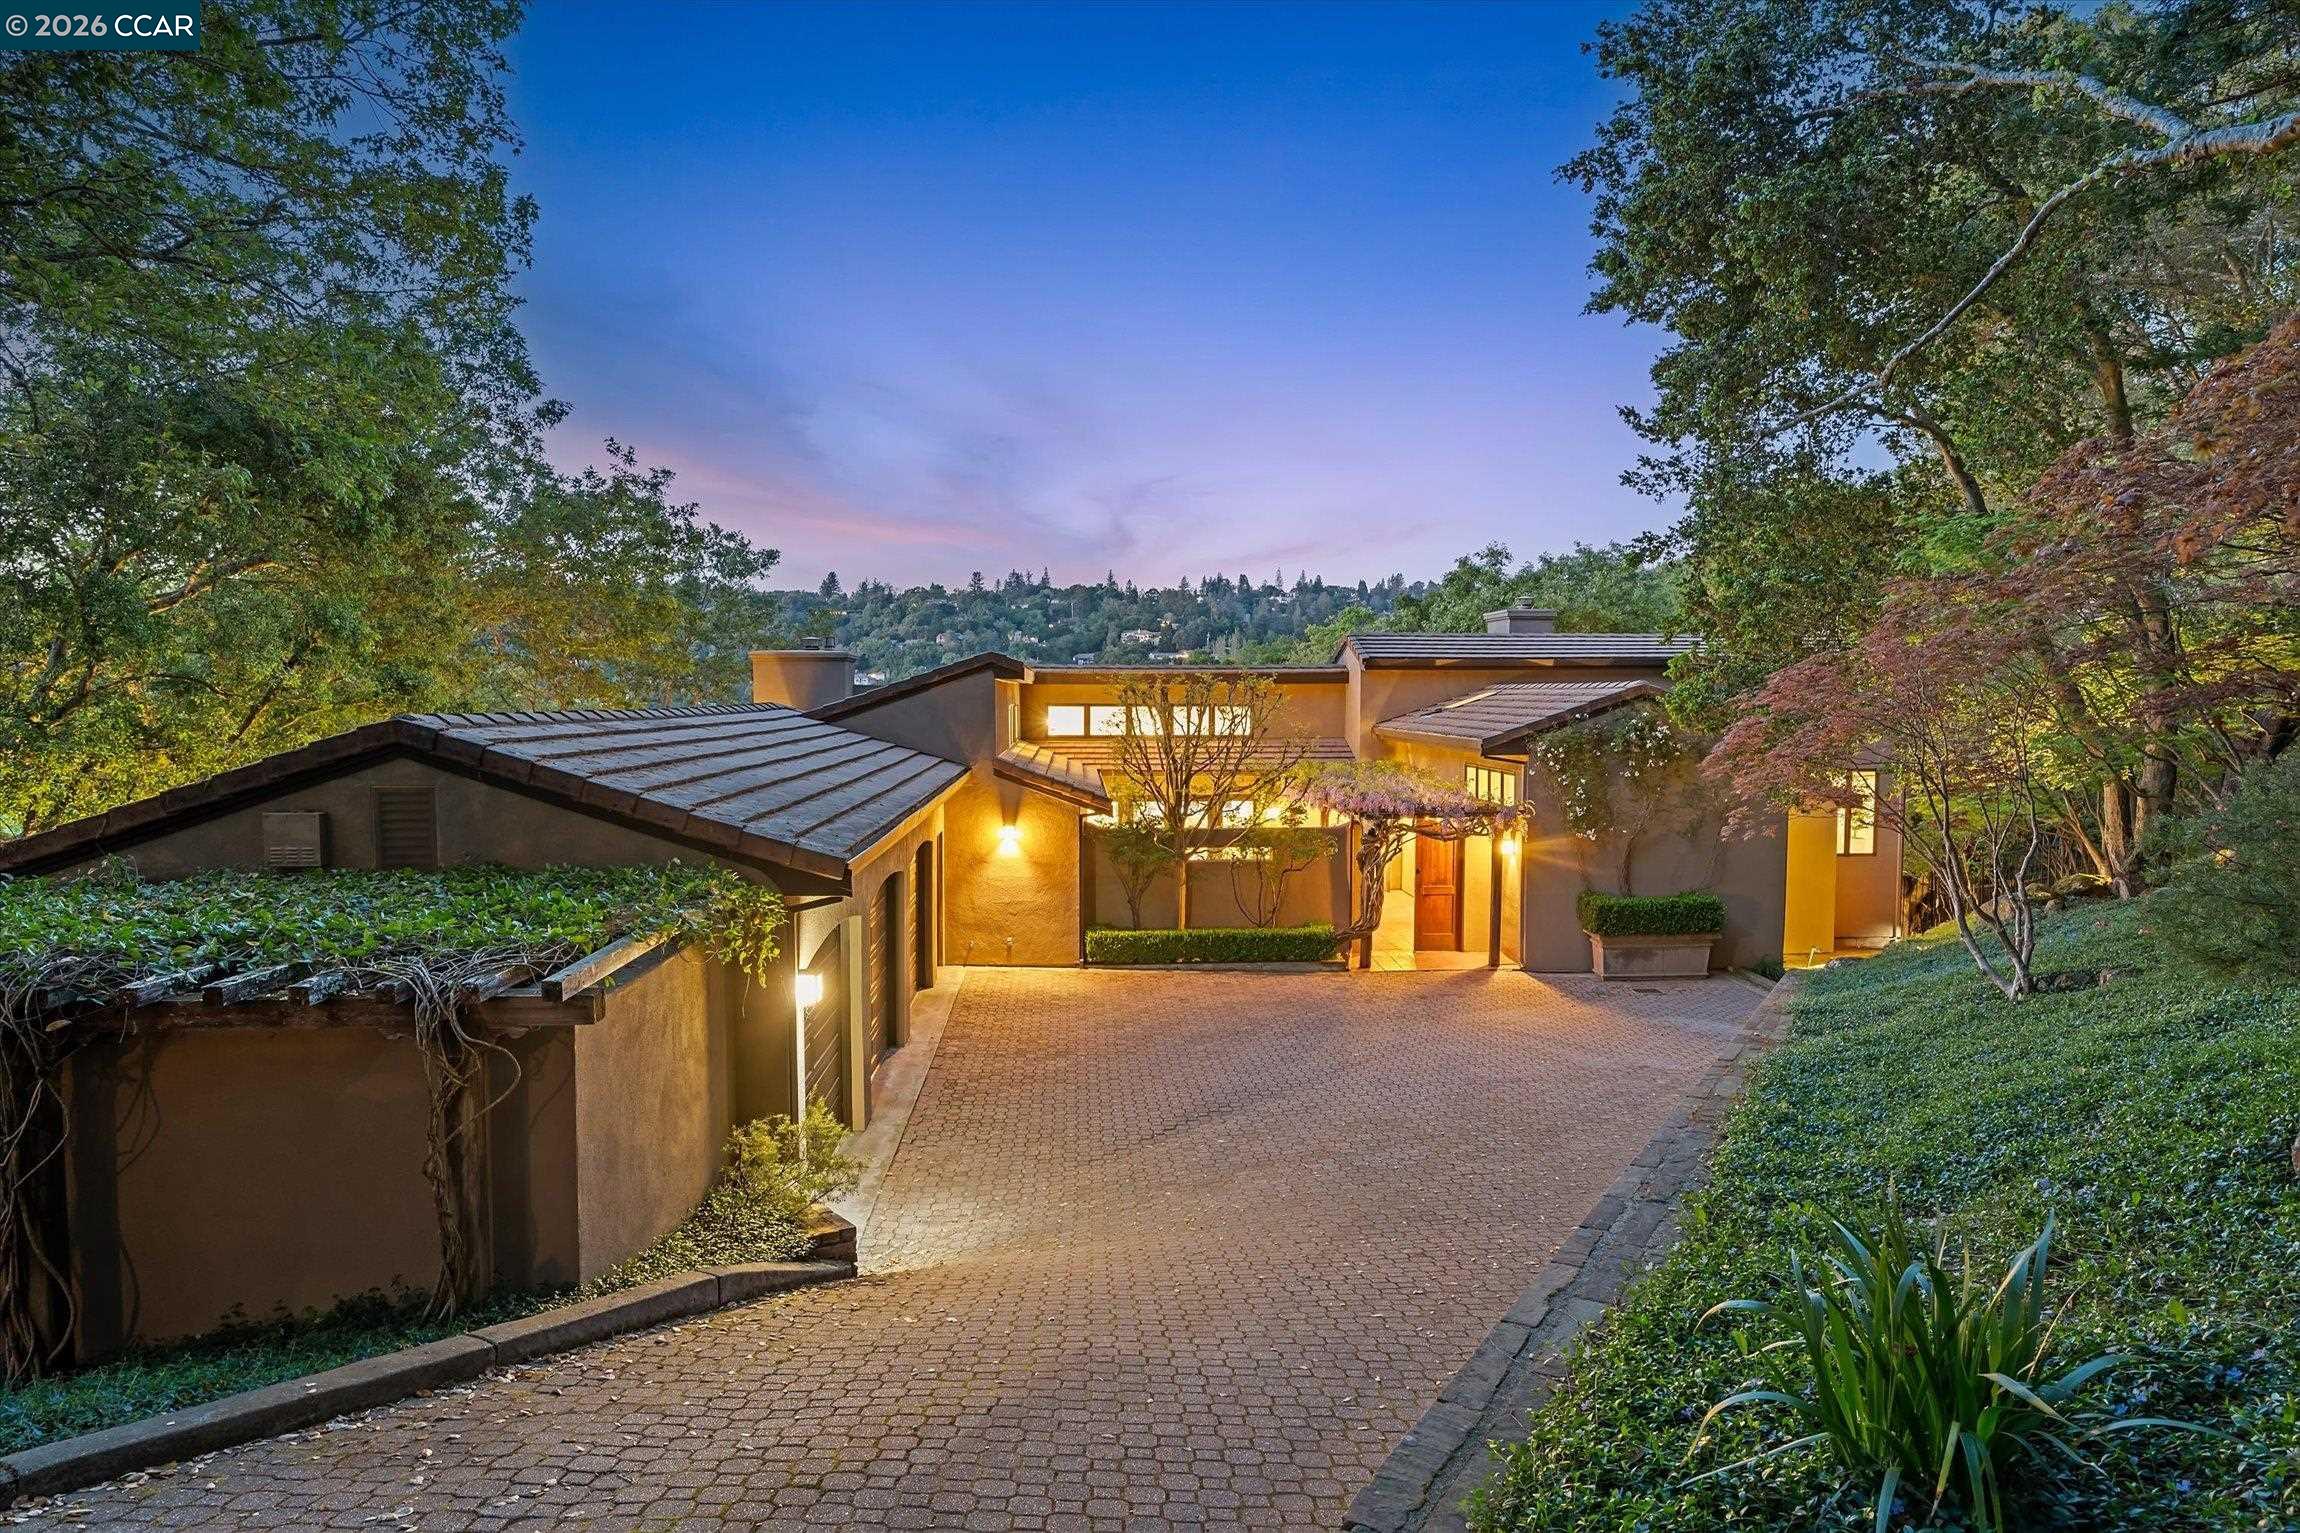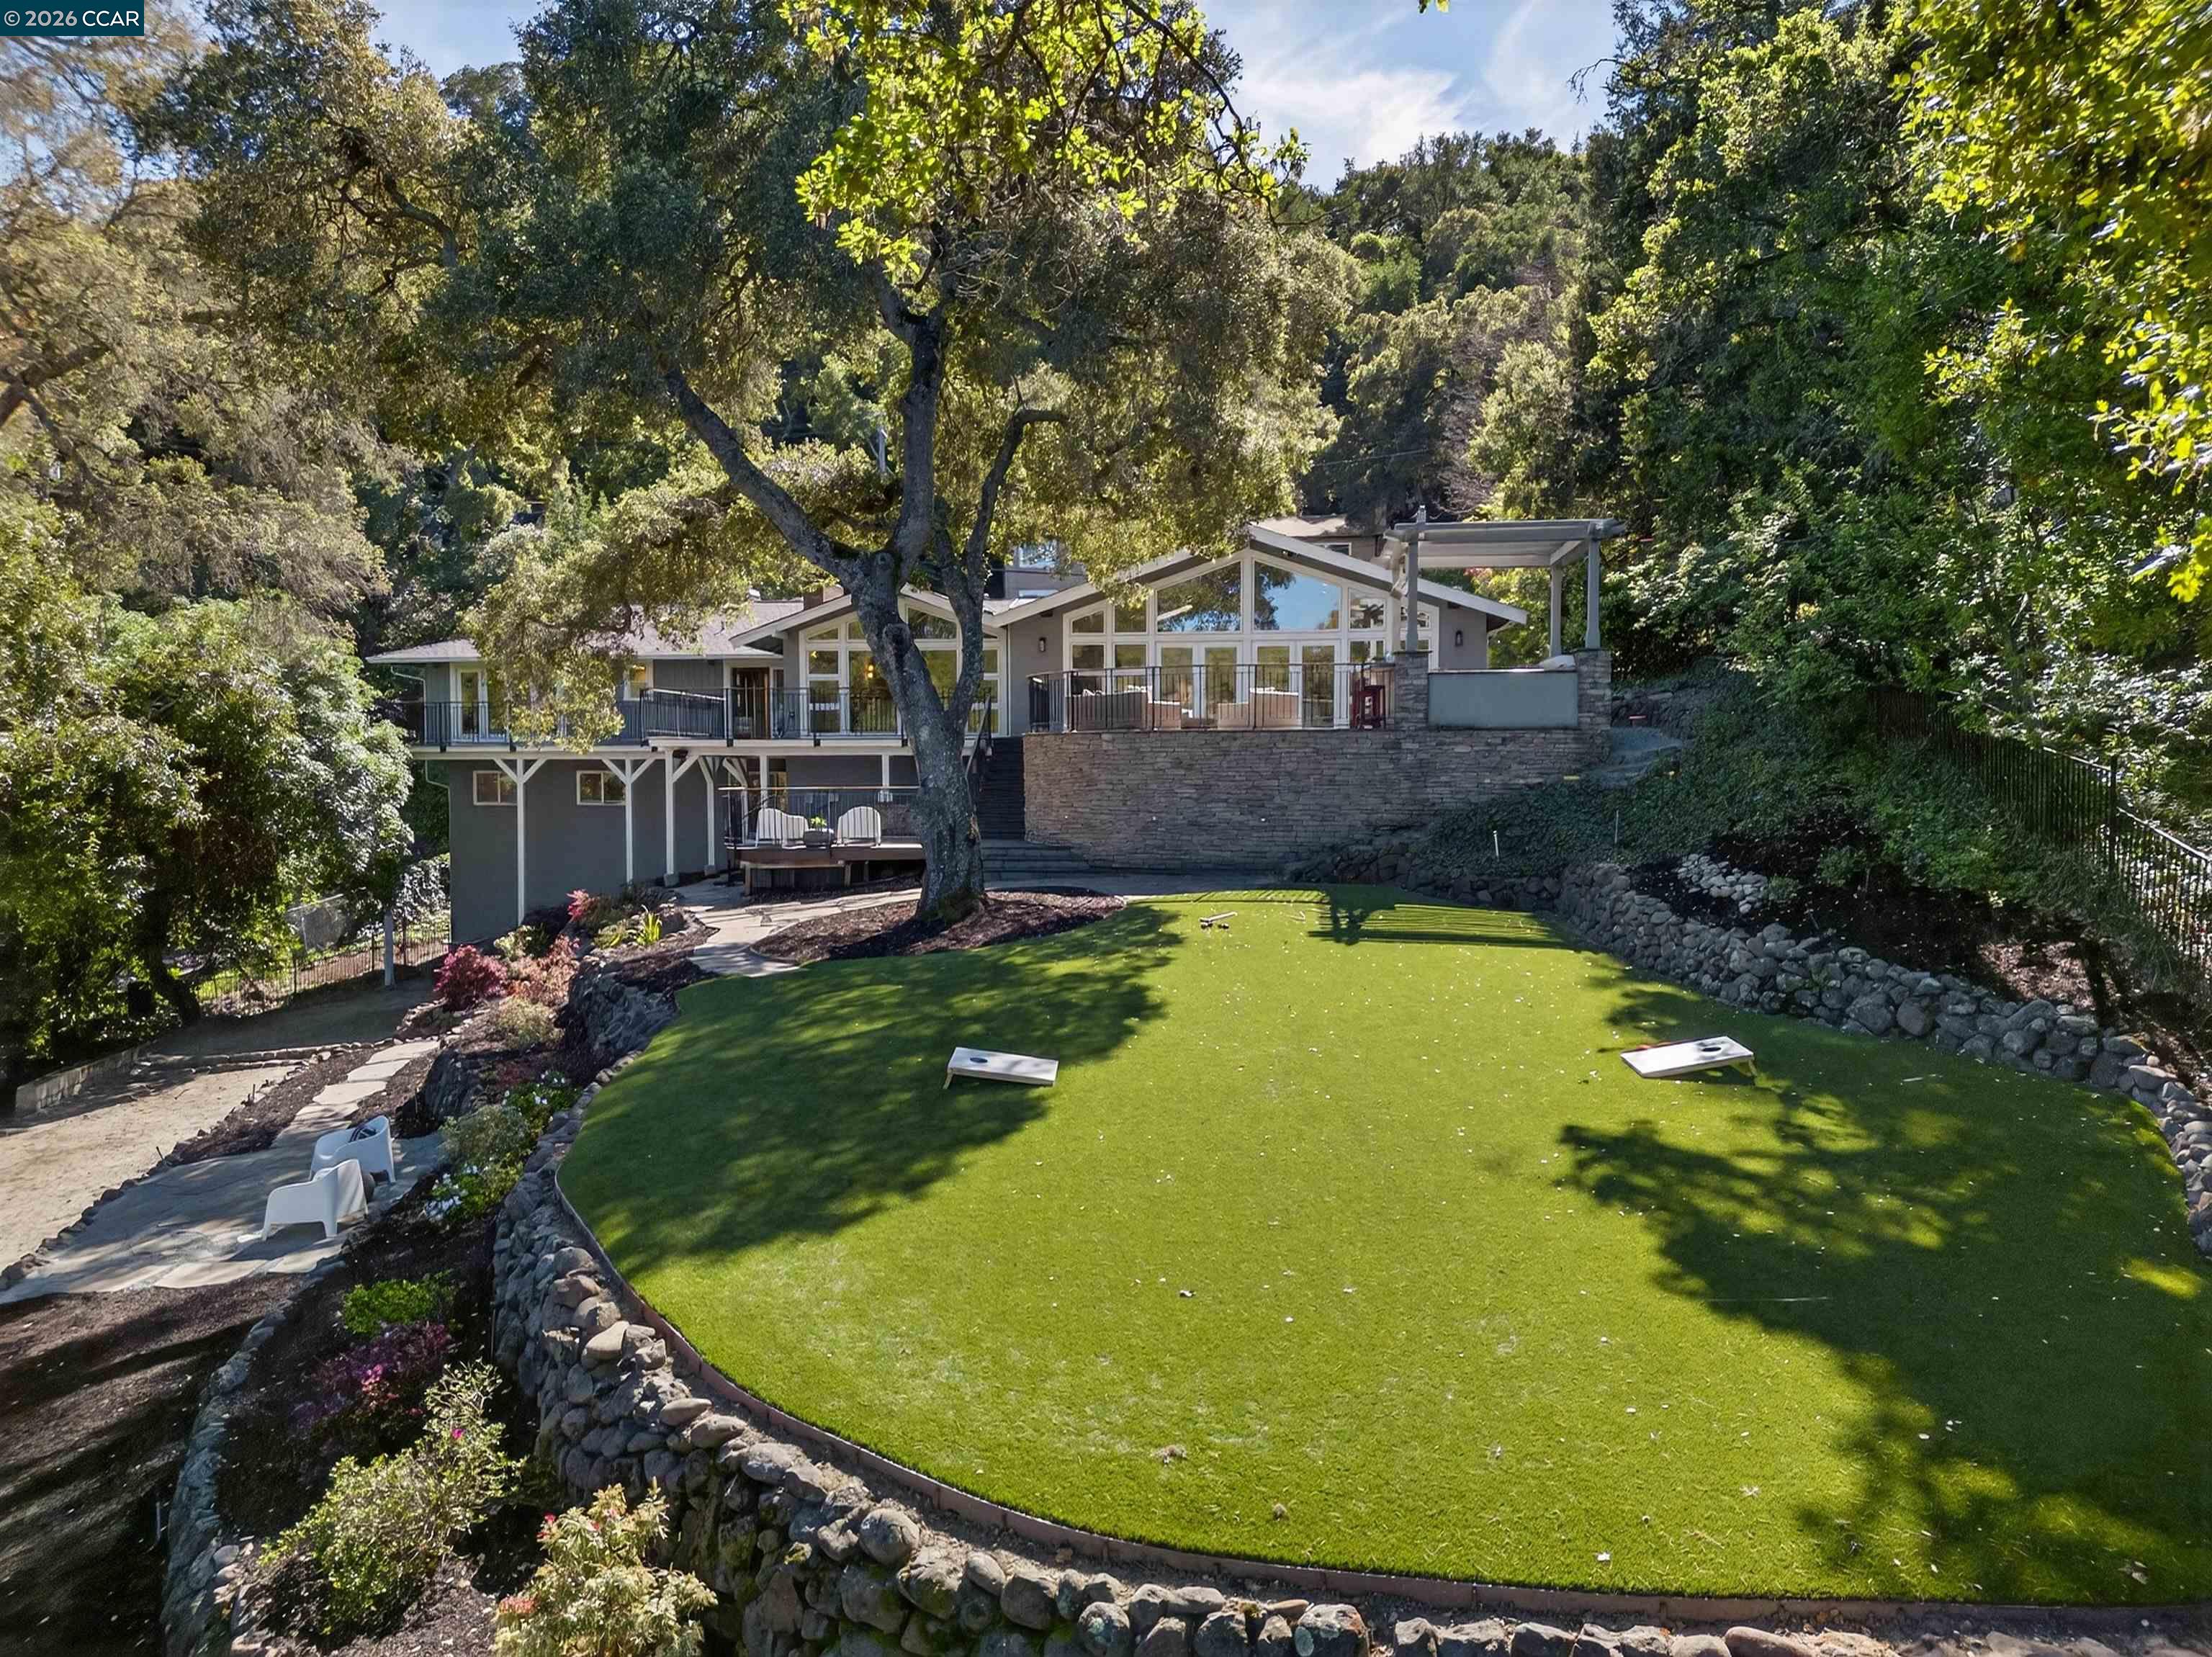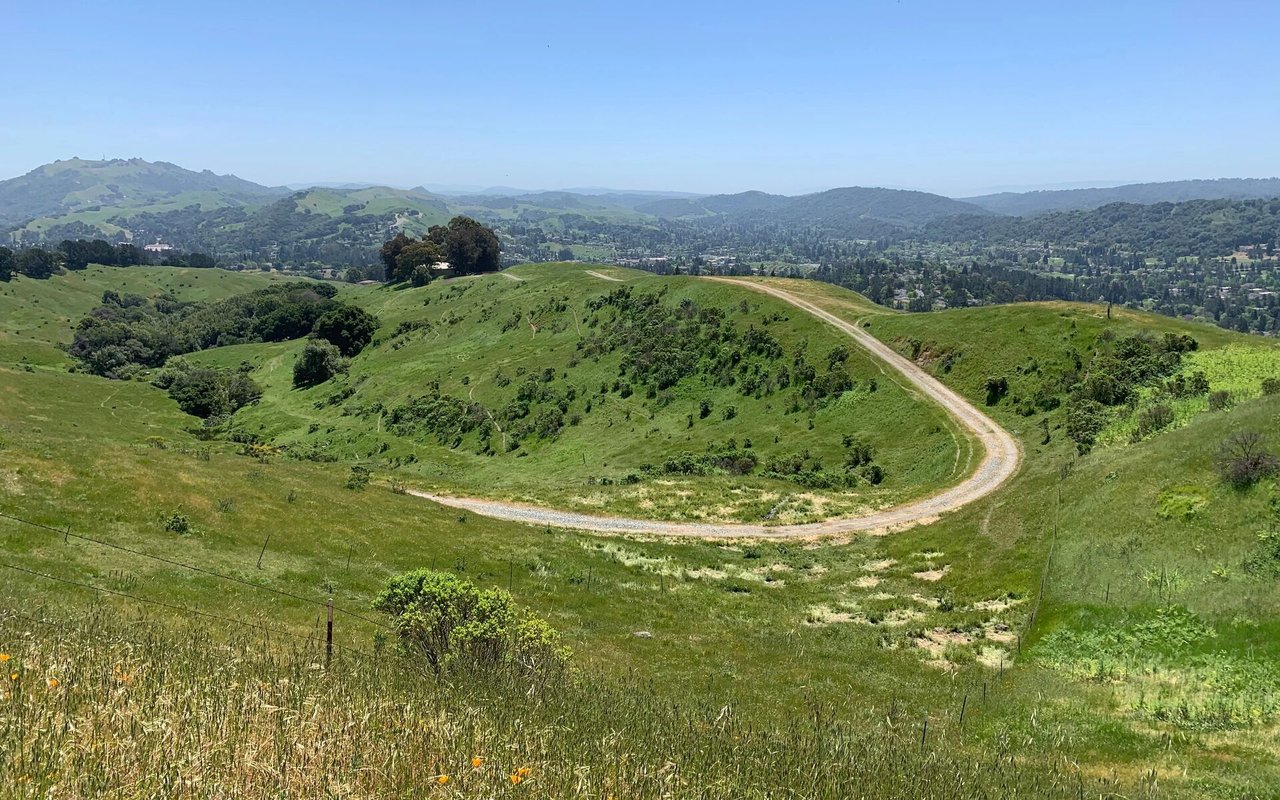
Sleepy Hollow | Orinda Downs
Offers easy access to big-city services, amenities, and attractions in nearby San Francisco and Oakland.
Offers easy access to big-city services, amenities, and attractions in nearby San Francisco and Oakland.
19,409 people live in Sleepy Hollow | Orinda Downs, where the median age is 49 and the average individual income is $139,732. Data provided by the U.S. Census Bureau.
Total Population
Median Age
Population Density Population Density This is the number of people per square mile in a neighborhood.
Average individual Income
There's plenty to do around Sleepy Hollow | Orinda Downs, including shopping, dining, nightlife, parks, and more. Data provided by Walk Score and Yelp.
Explore popular things to do in the area, including Bella Bakes, Onyx Custom Suiting, and Phoenix Rising Institute Of Martial Arts.
| Name | Category | Distance | Reviews |
Ratings by
Yelp
|
|---|---|---|---|---|
| Dining | 0.49 miles | 14 reviews | 5/5 stars | |
| Shopping | 4.29 miles | 42 reviews | 5/5 stars | |
| Active | 0.83 miles | 7 reviews | 5/5 stars | |
| Active | 3.34 miles | 63 reviews | 5/5 stars | |
| Active | 0.78 miles | 11 reviews | 5/5 stars | |
| Active | 3.2 miles | 11 reviews | 5/5 stars | |
| Nightlife | 3.37 miles | 16 reviews | 5/5 stars | |
| Beauty | 4.21 miles | 16 reviews | 5/5 stars | |
| Beauty | 0.71 miles | 20 reviews | 5/5 stars | |
| Beauty | 3.48 miles | 25 reviews | 5/5 stars | |
| Beauty | 0.77 miles | 26 reviews | 5/5 stars | |
| Beauty | 0.71 miles | 13 reviews | 5/5 stars | |
| Beauty | 3.4 miles | 29 reviews | 5/5 stars | |
| Beauty | 0.34 miles | 9 reviews | 5/5 stars | |
| Beauty | 4.25 miles | 88 reviews | 5/5 stars | |
| Beauty | 0.77 miles | 15 reviews | 5/5 stars | |
| Beauty | 4.05 miles | 9 reviews | 5/5 stars | |
| Beauty | 4.95 miles | 14 reviews | 5/5 stars | |
| Beauty | 4.13 miles | 7 reviews | 5/5 stars | |
|
|
||||
|
|
||||
|
|
||||
|
|
||||
|
|
||||
|
|
Sleepy Hollow | Orinda Downs has 7,349 households, with an average household size of 2.63. Data provided by the U.S. Census Bureau. Here’s what the people living in Sleepy Hollow | Orinda Downs do for work — and how long it takes them to get there. Data provided by the U.S. Census Bureau. 19,409 people call Sleepy Hollow | Orinda Downs home. The population density is 945.73 and the largest age group is Data provided by the U.S. Census Bureau.
Total Population
Population Density Population Density This is the number of people per square mile in a neighborhood.
Median Age
Men vs Women
Population by Age Group
0-9 Years
10-17 Years
18-24 Years
25-64 Years
65-74 Years
75+ Years
Education Level
Total Households
Average Household Size
Average individual Income
Households with Children
With Children:
Without Children:
Marital Status
Blue vs White Collar Workers
Blue Collar:
White Collar:
We'd love to hear from you! Whether you're buying, selling, or just exploring your options, we're here to provide answers, insights, and the support you need. Contact us and start planning your next move.